
Goals
- Empower the public with clear, actionable water quality information.
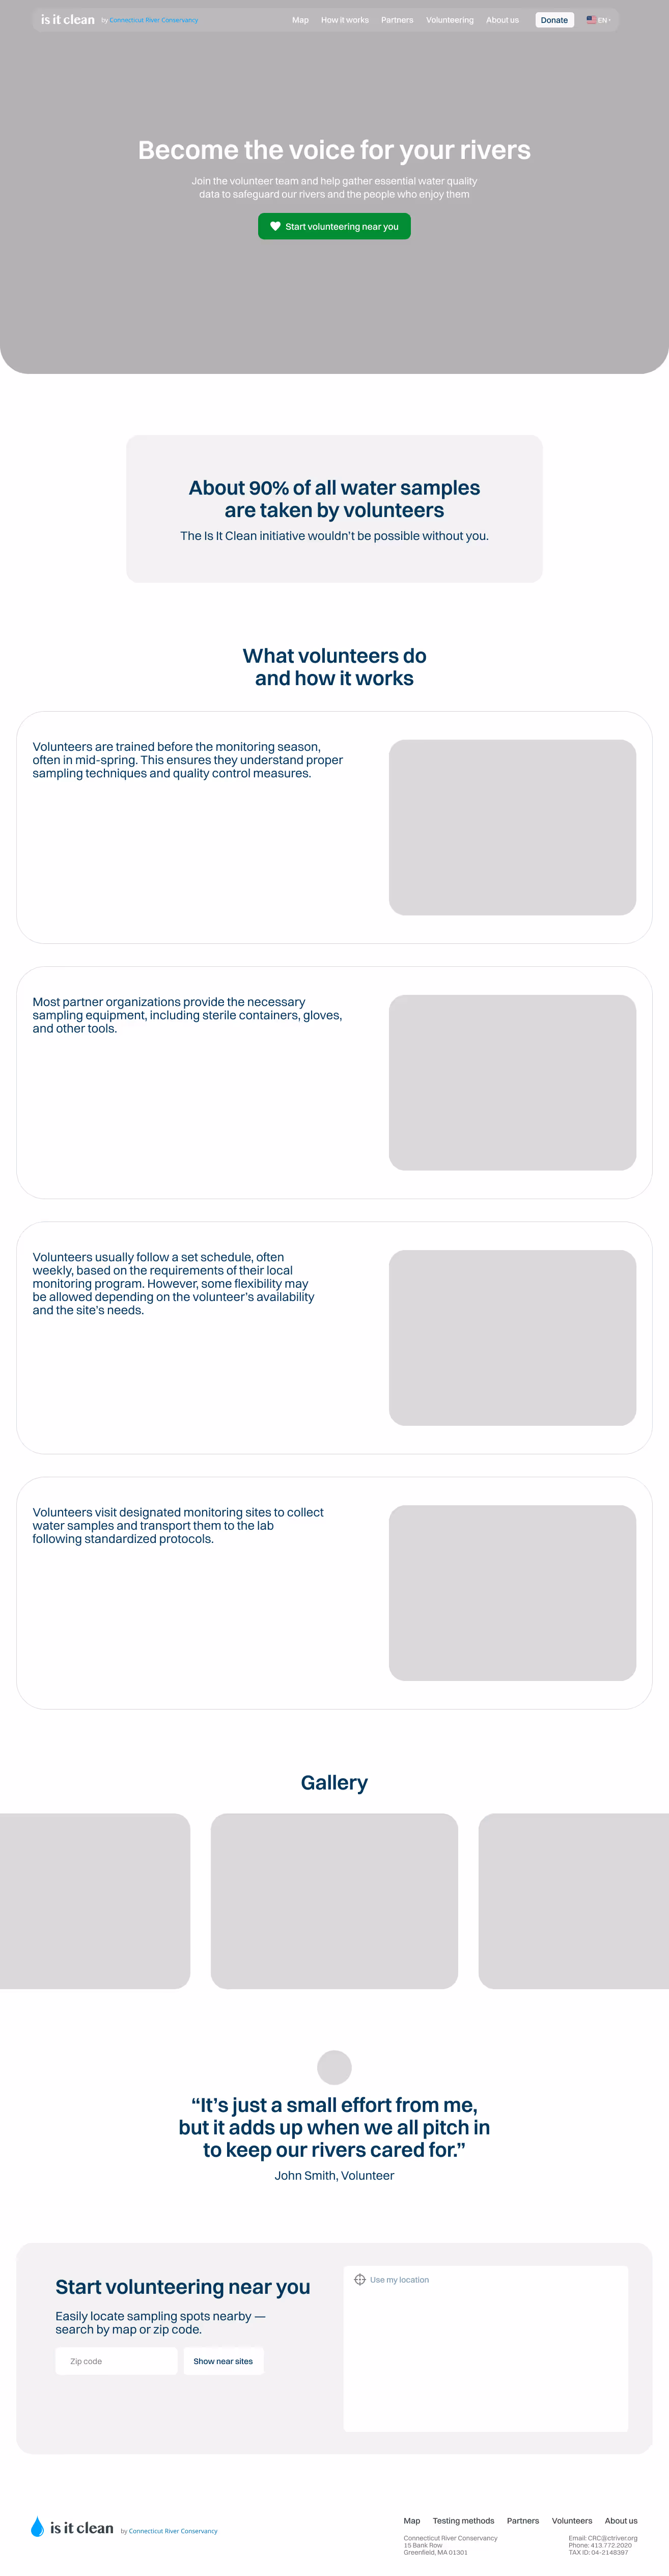
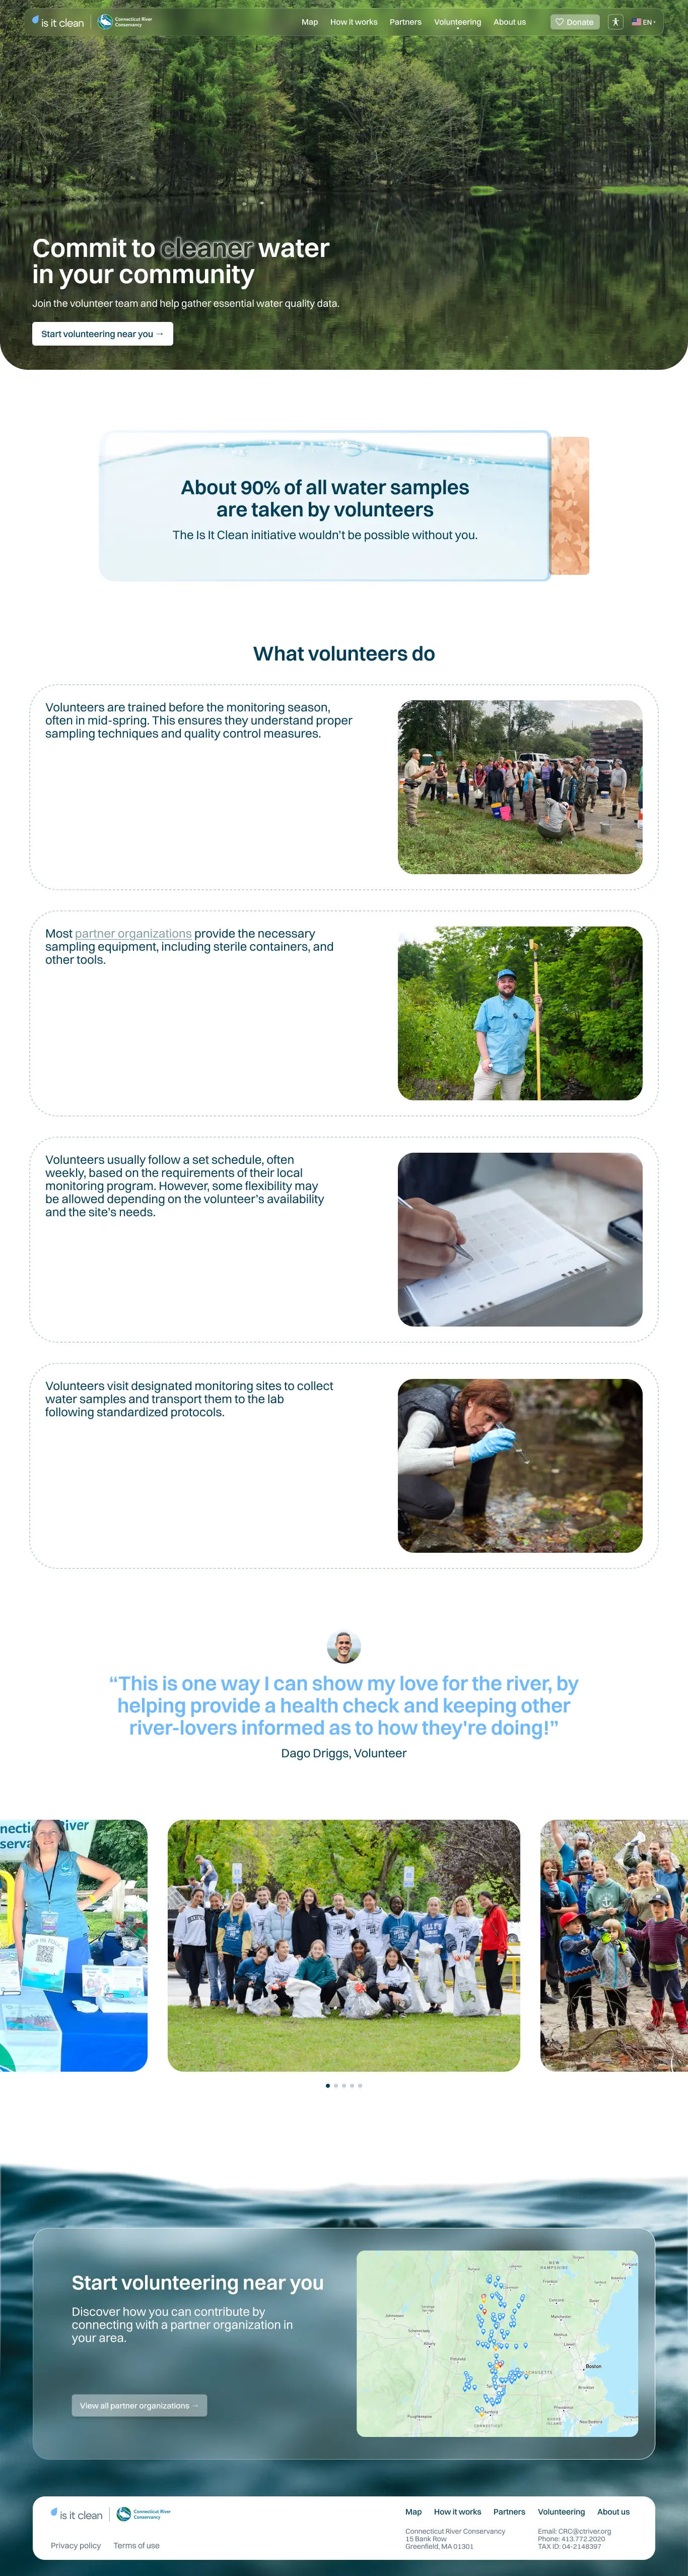
- Support volunteers and partner organizations who collect data.
- Connect the tool more closely to CRC's core environmental mission.
- Improve accessibility, trust, and mobile usability.
Discovery & Direction
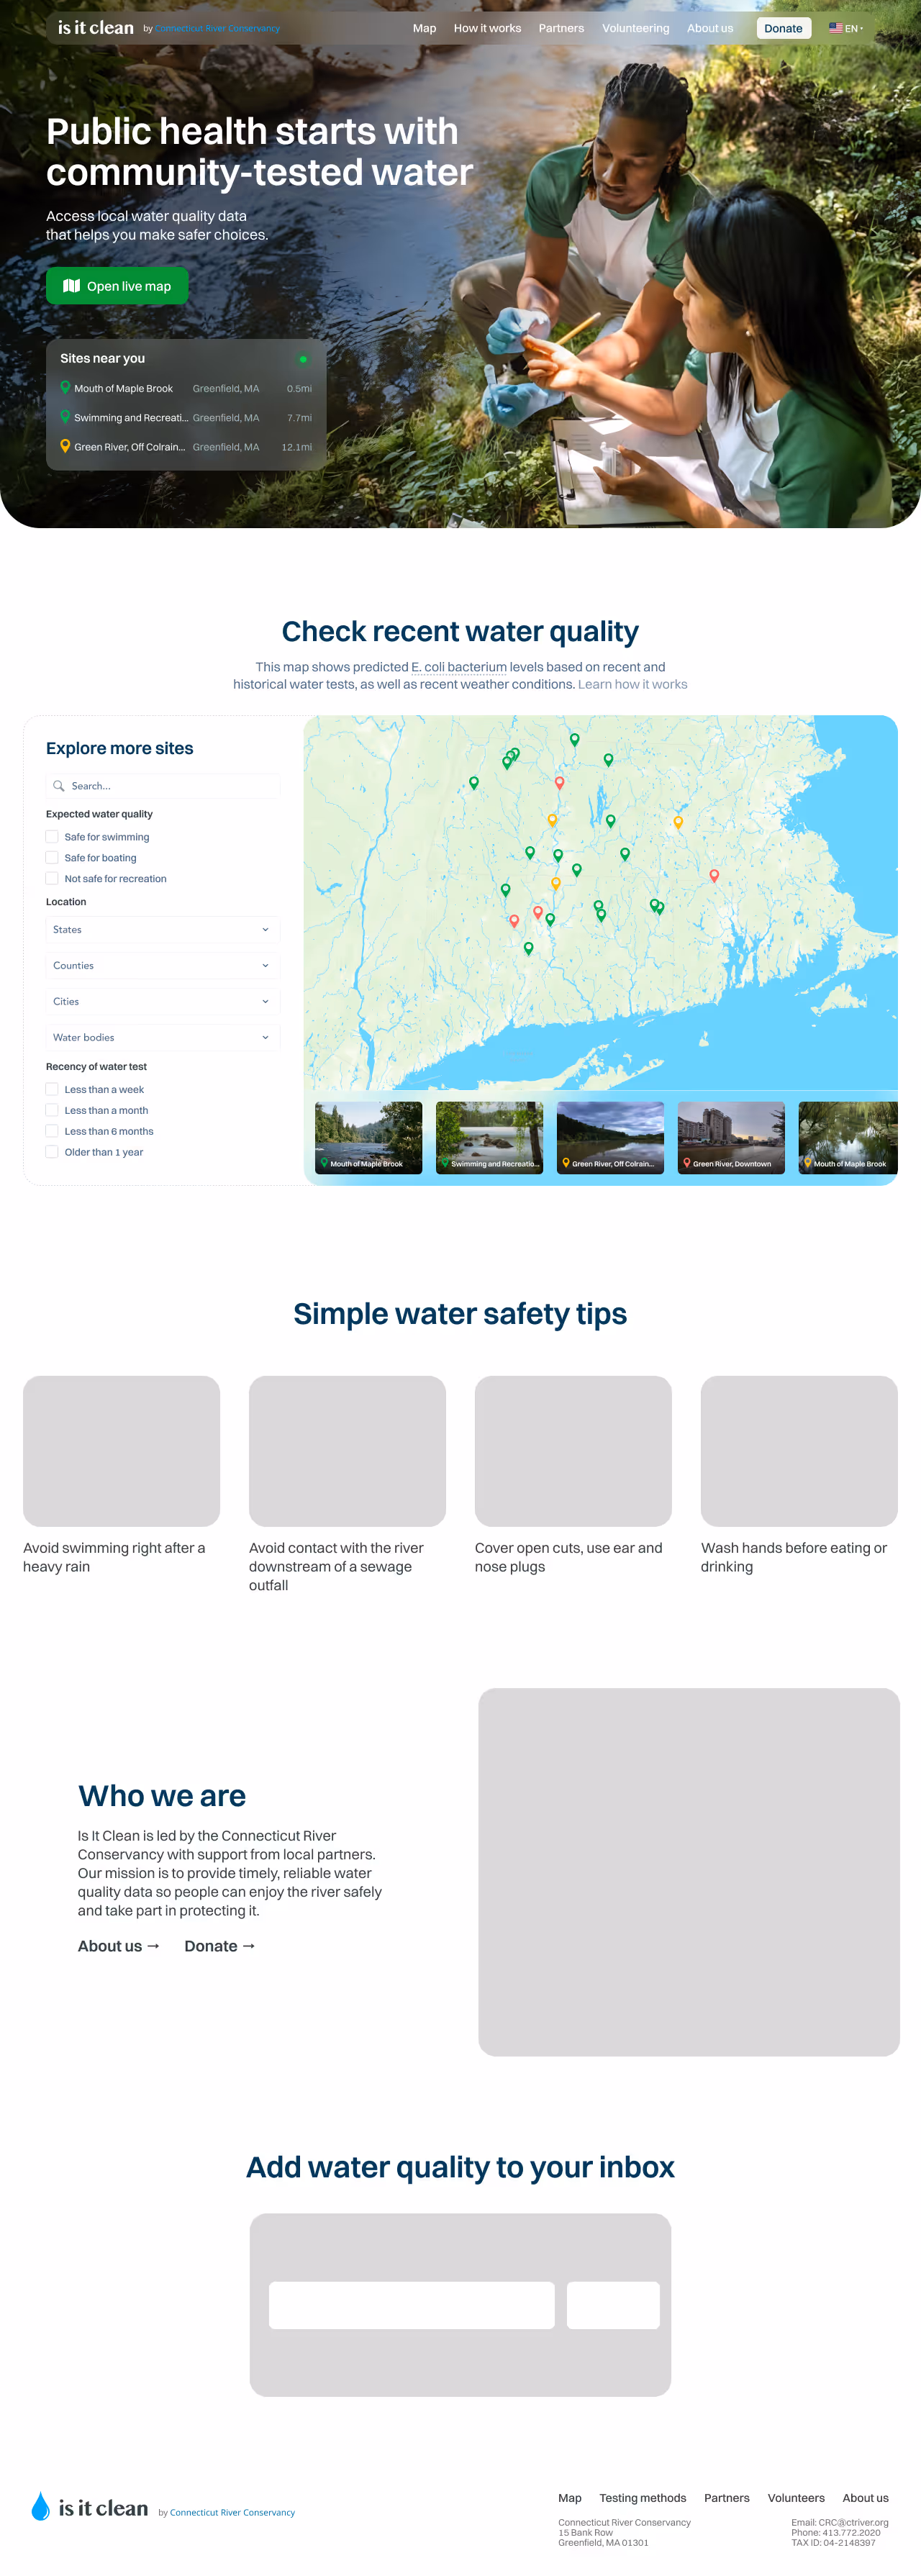
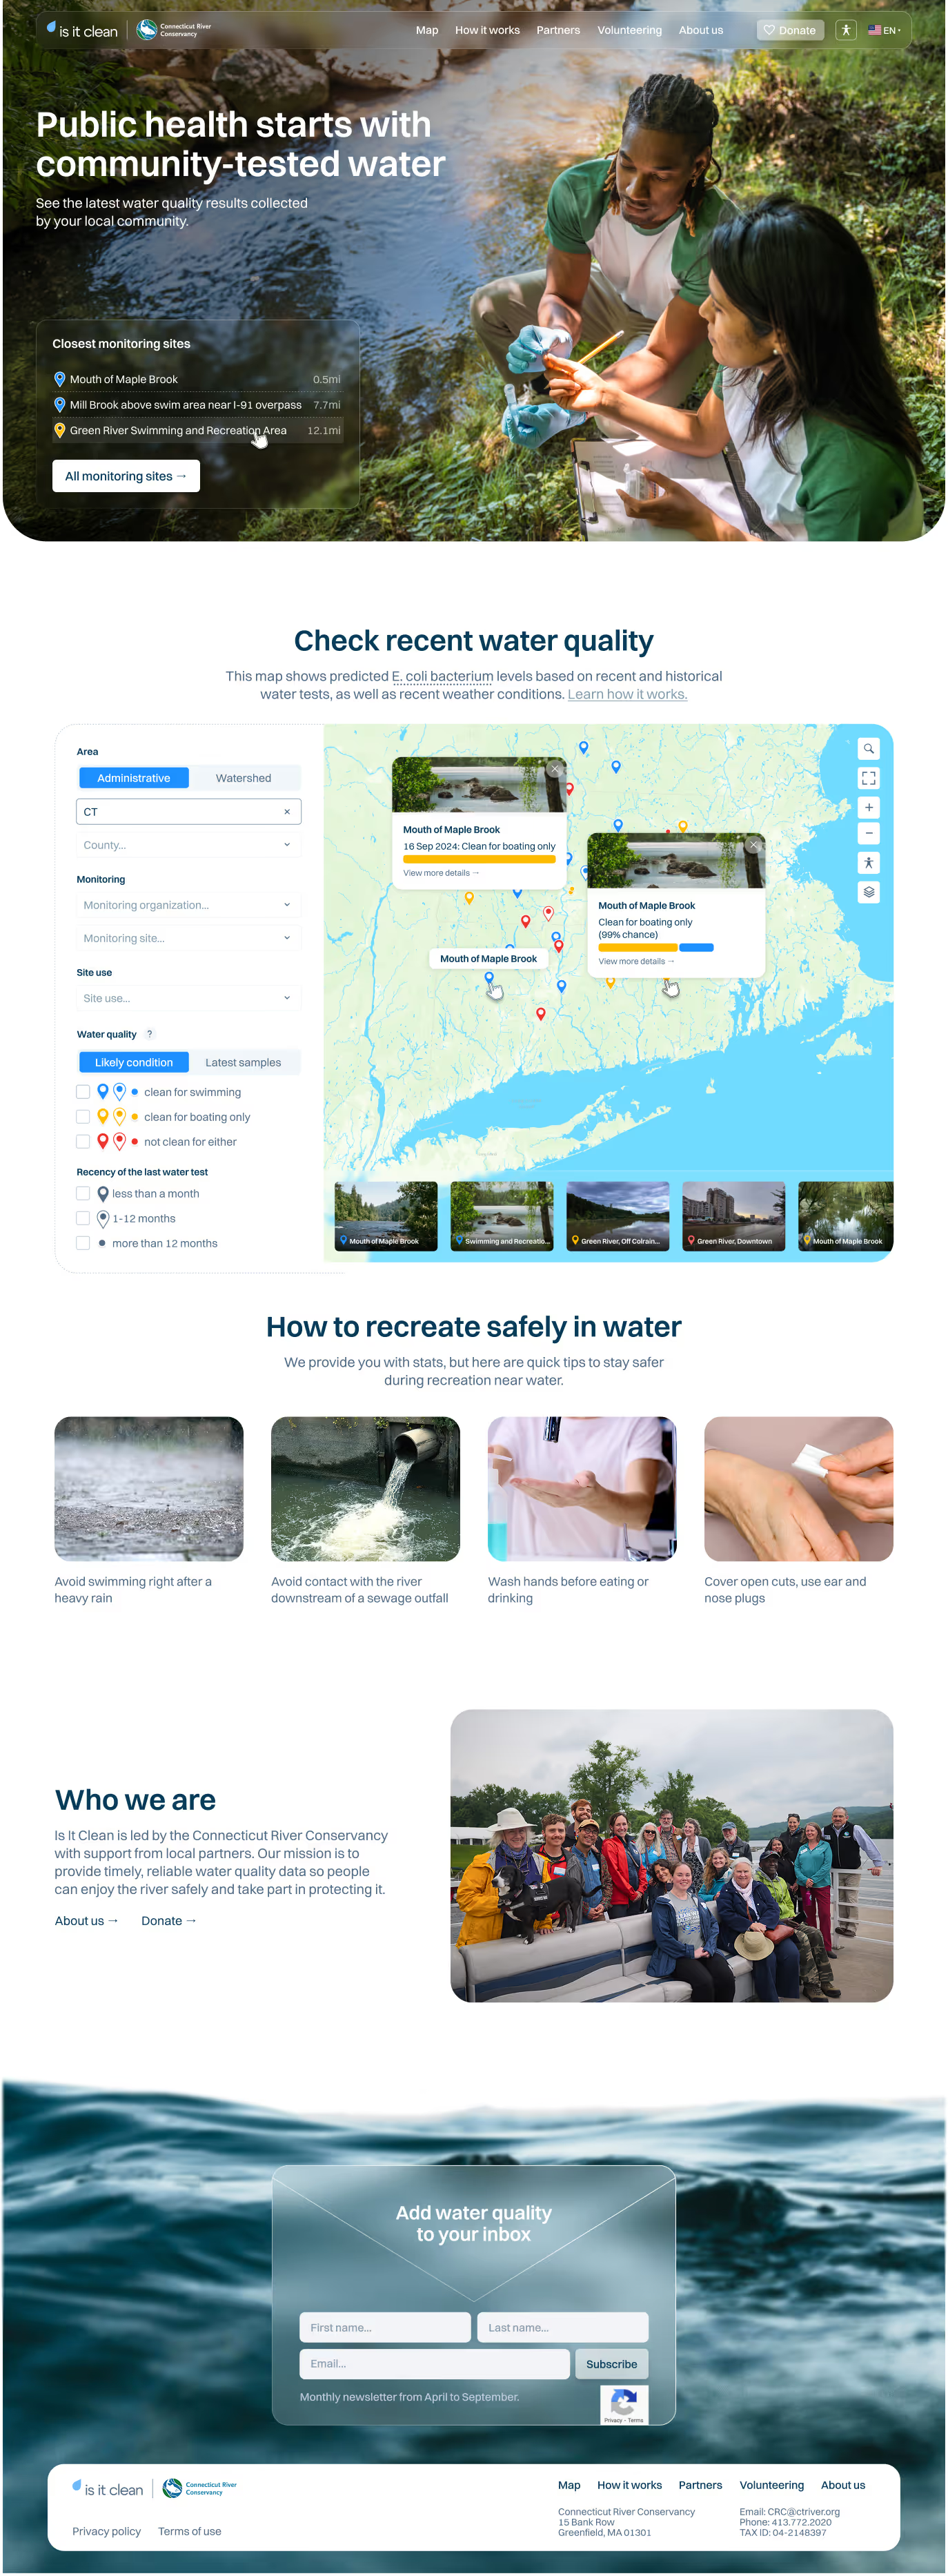
Our kickoff revealed a key insight: IsItClean.org is often the first or only touchpoint with CRC. Visitors range from local swimmers checking for safe spots to environmental partners accessing sampling data. Two main design directions were explored:
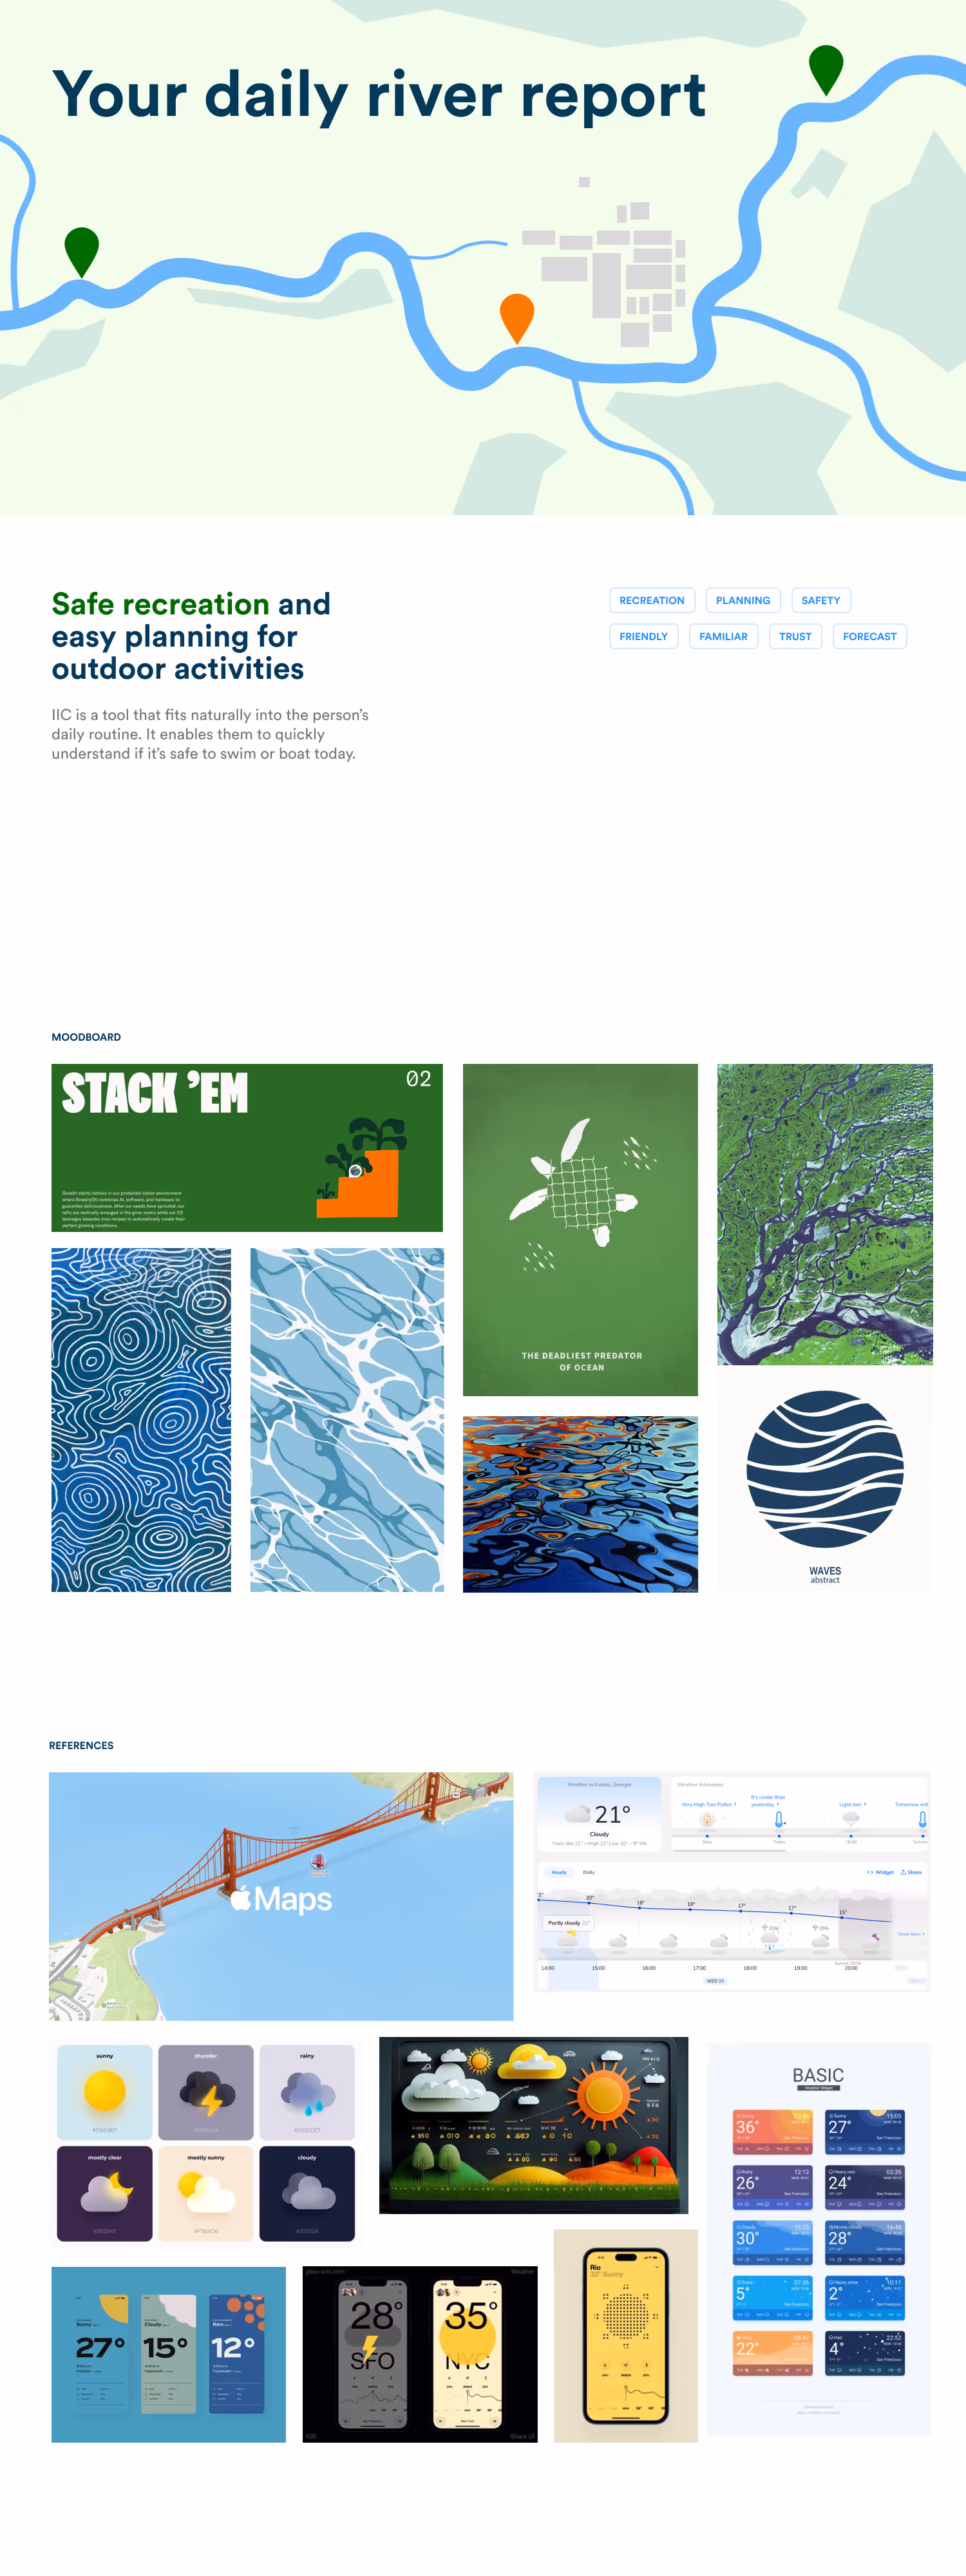
Safe recreation
Positioning the site as a clean water forecast tool.
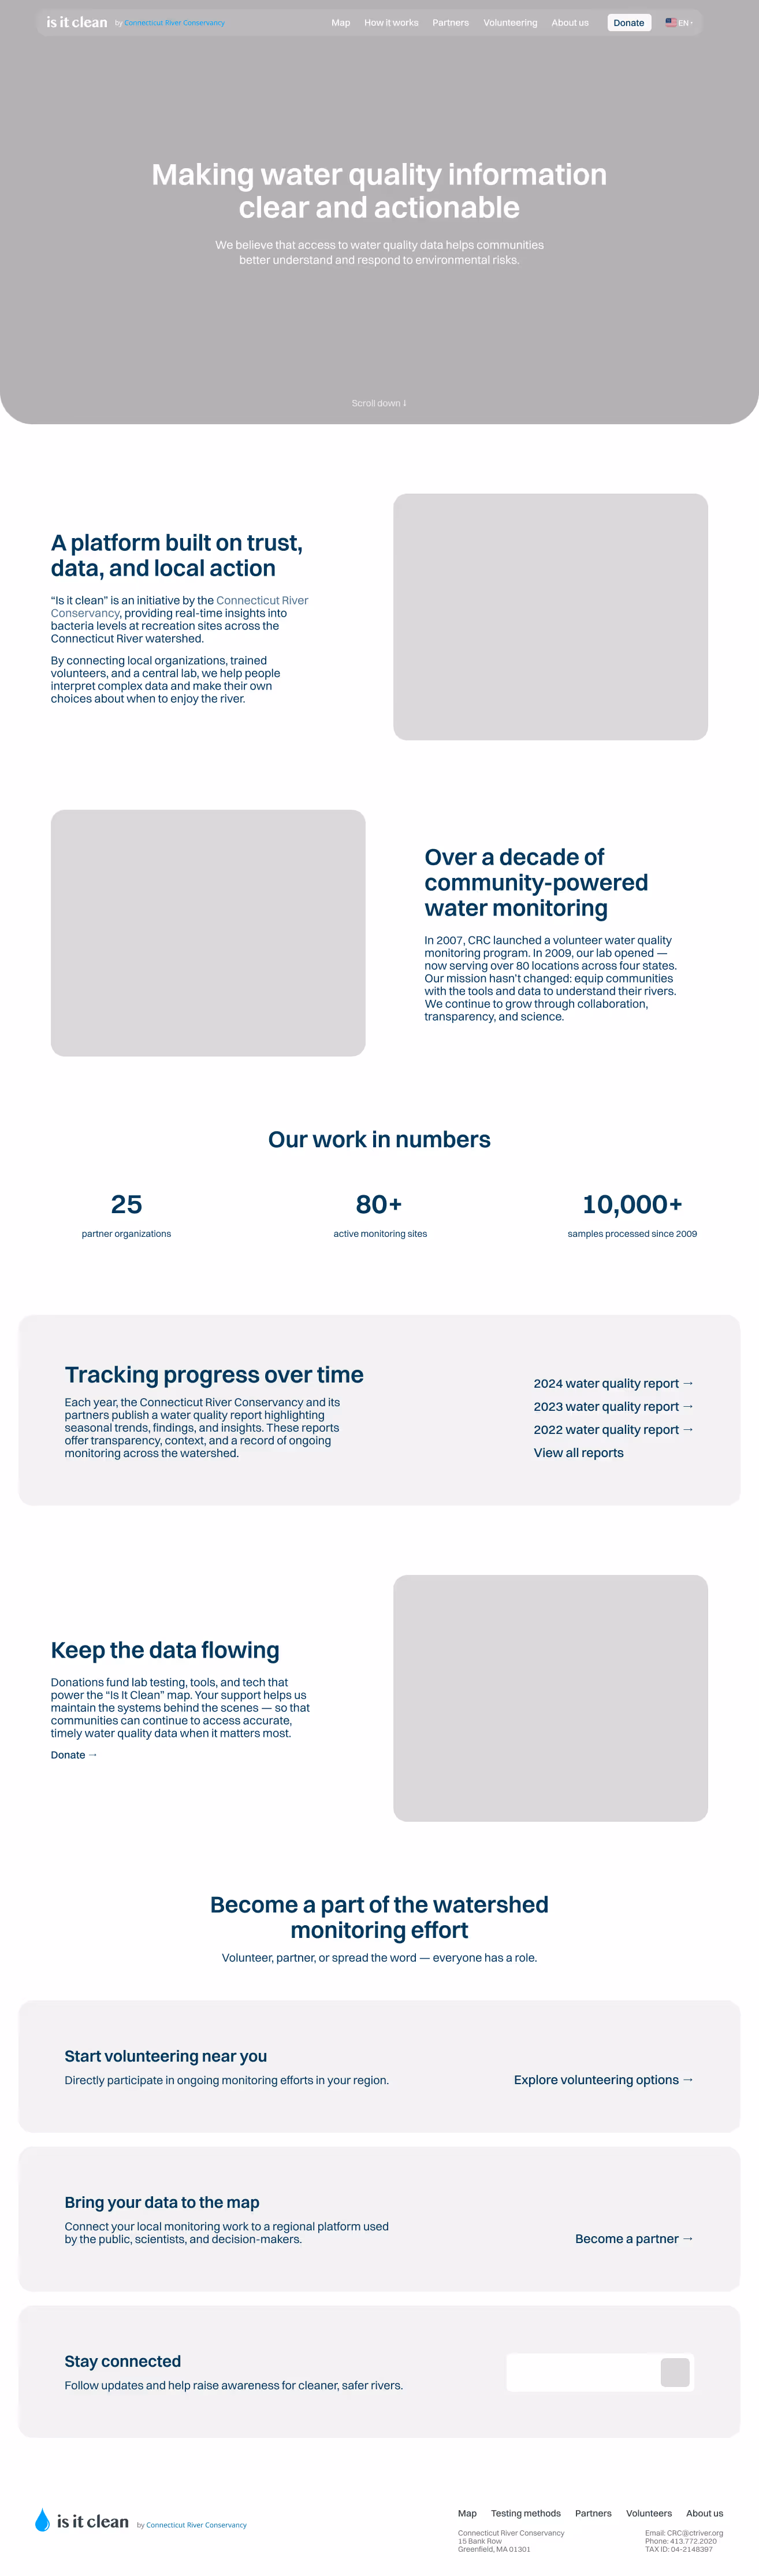
Community-driven
Highlighting the people and partnerships behind the data.
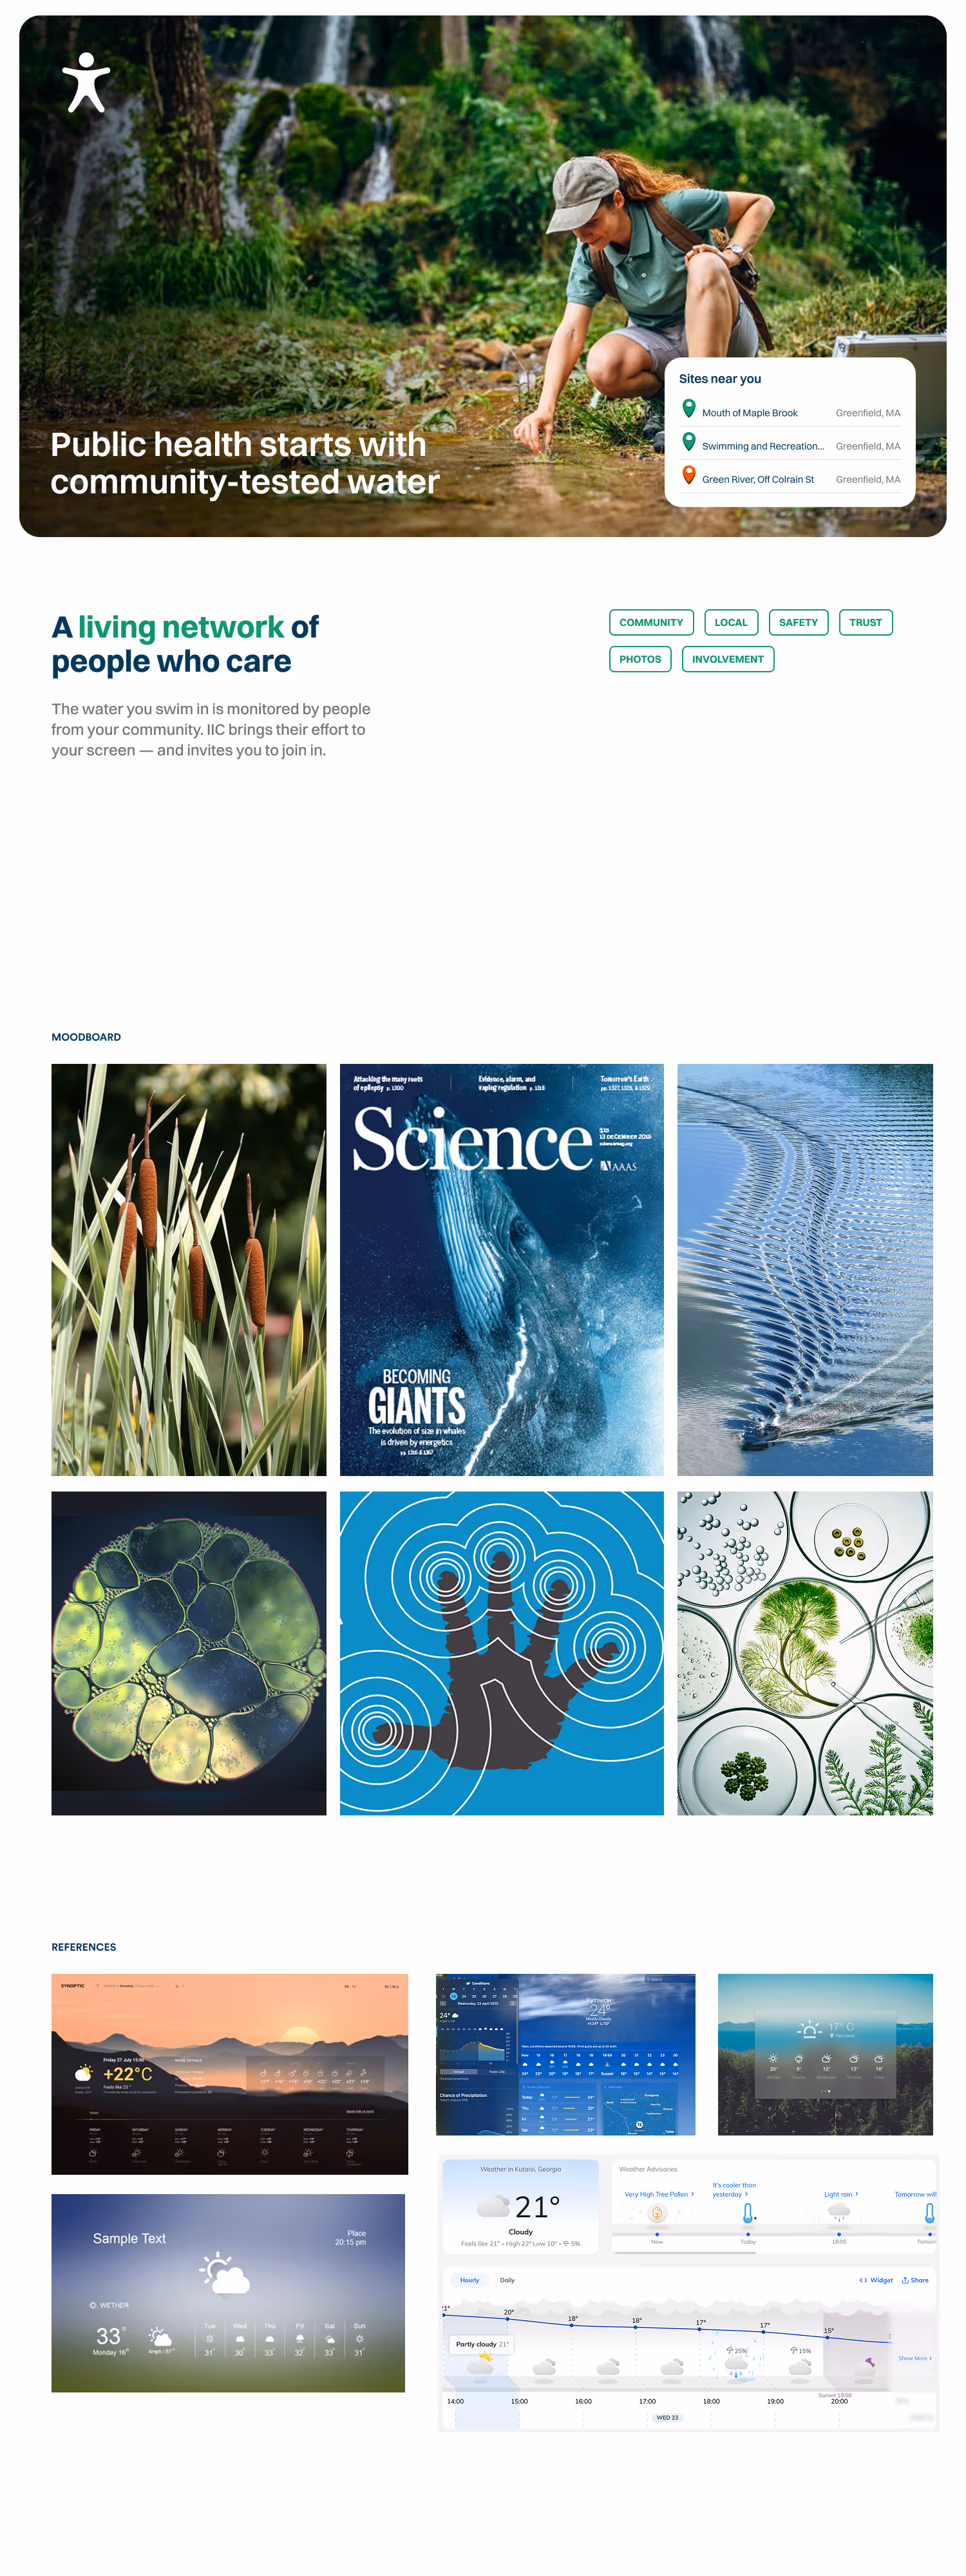
The team leaned toward the second, valuing emotional connection, volunteer visibility, and real-world imagery. This became the foundation of our visual system.
Brand & Visual Identity
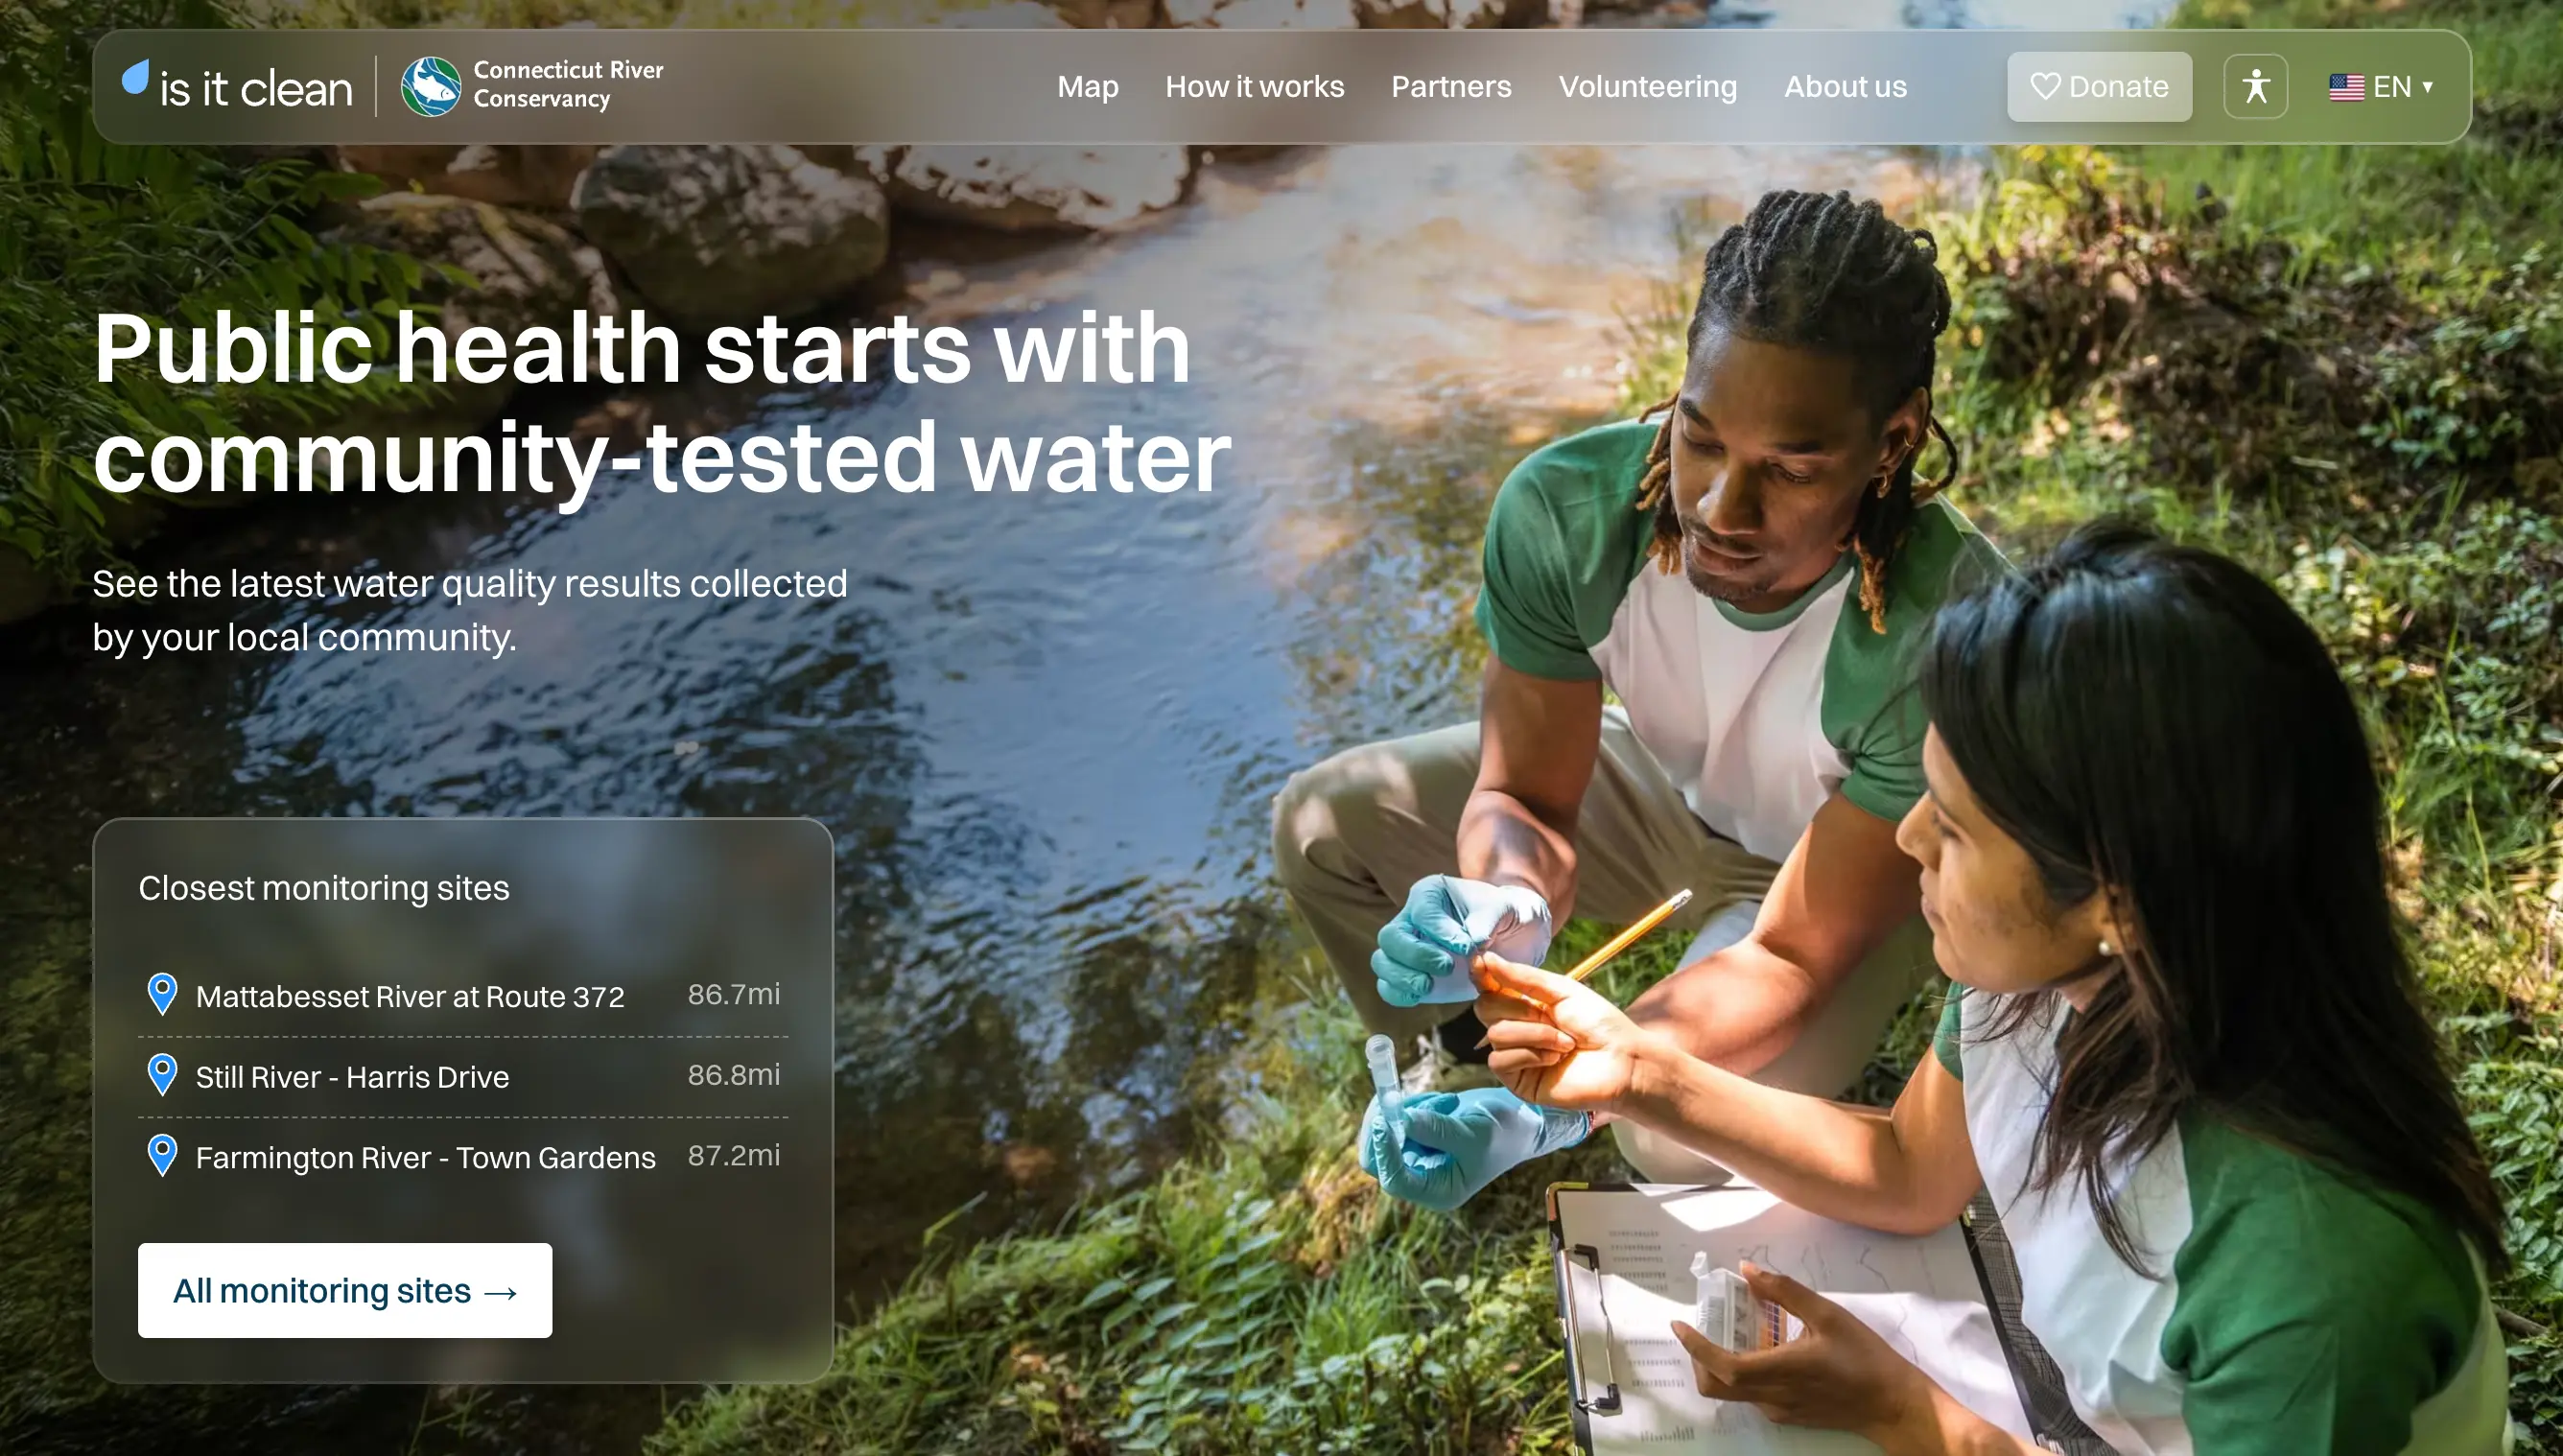
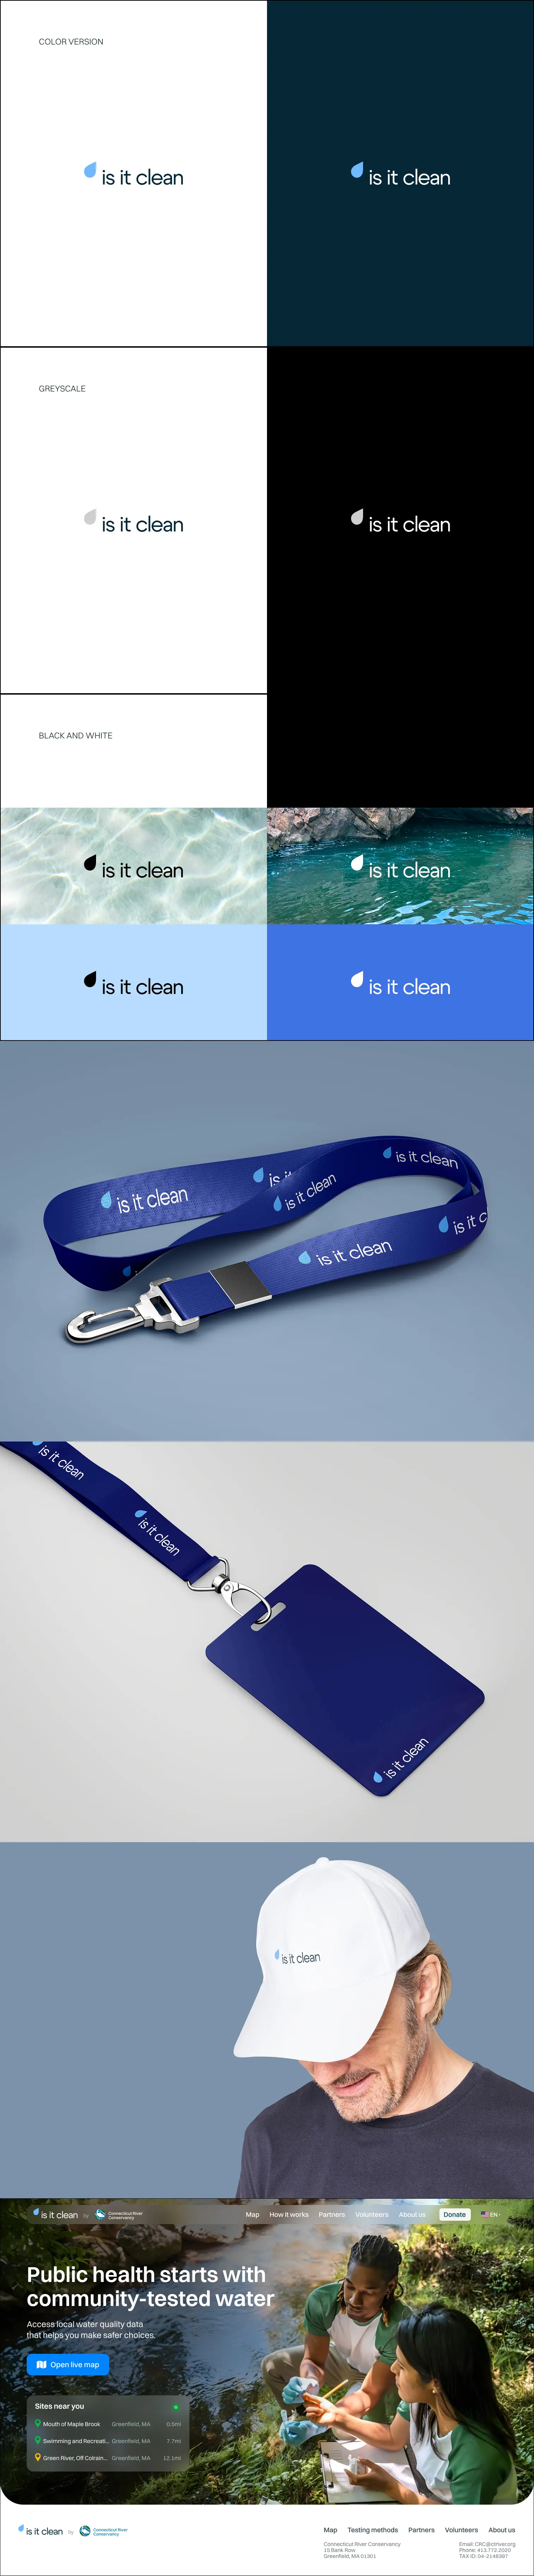
The new logomark — a tilted water droplet that also resembles a map pin — embodies both the data-driven and place-specific nature of the platform. It’s minimal, versatile, and designed to be understood at a glance.
Wireframes & Web Design
We began with extensive wireframing in Figma to map out key flows:
Wireframes
- A map-focused homepage with immediate access to water quality status.
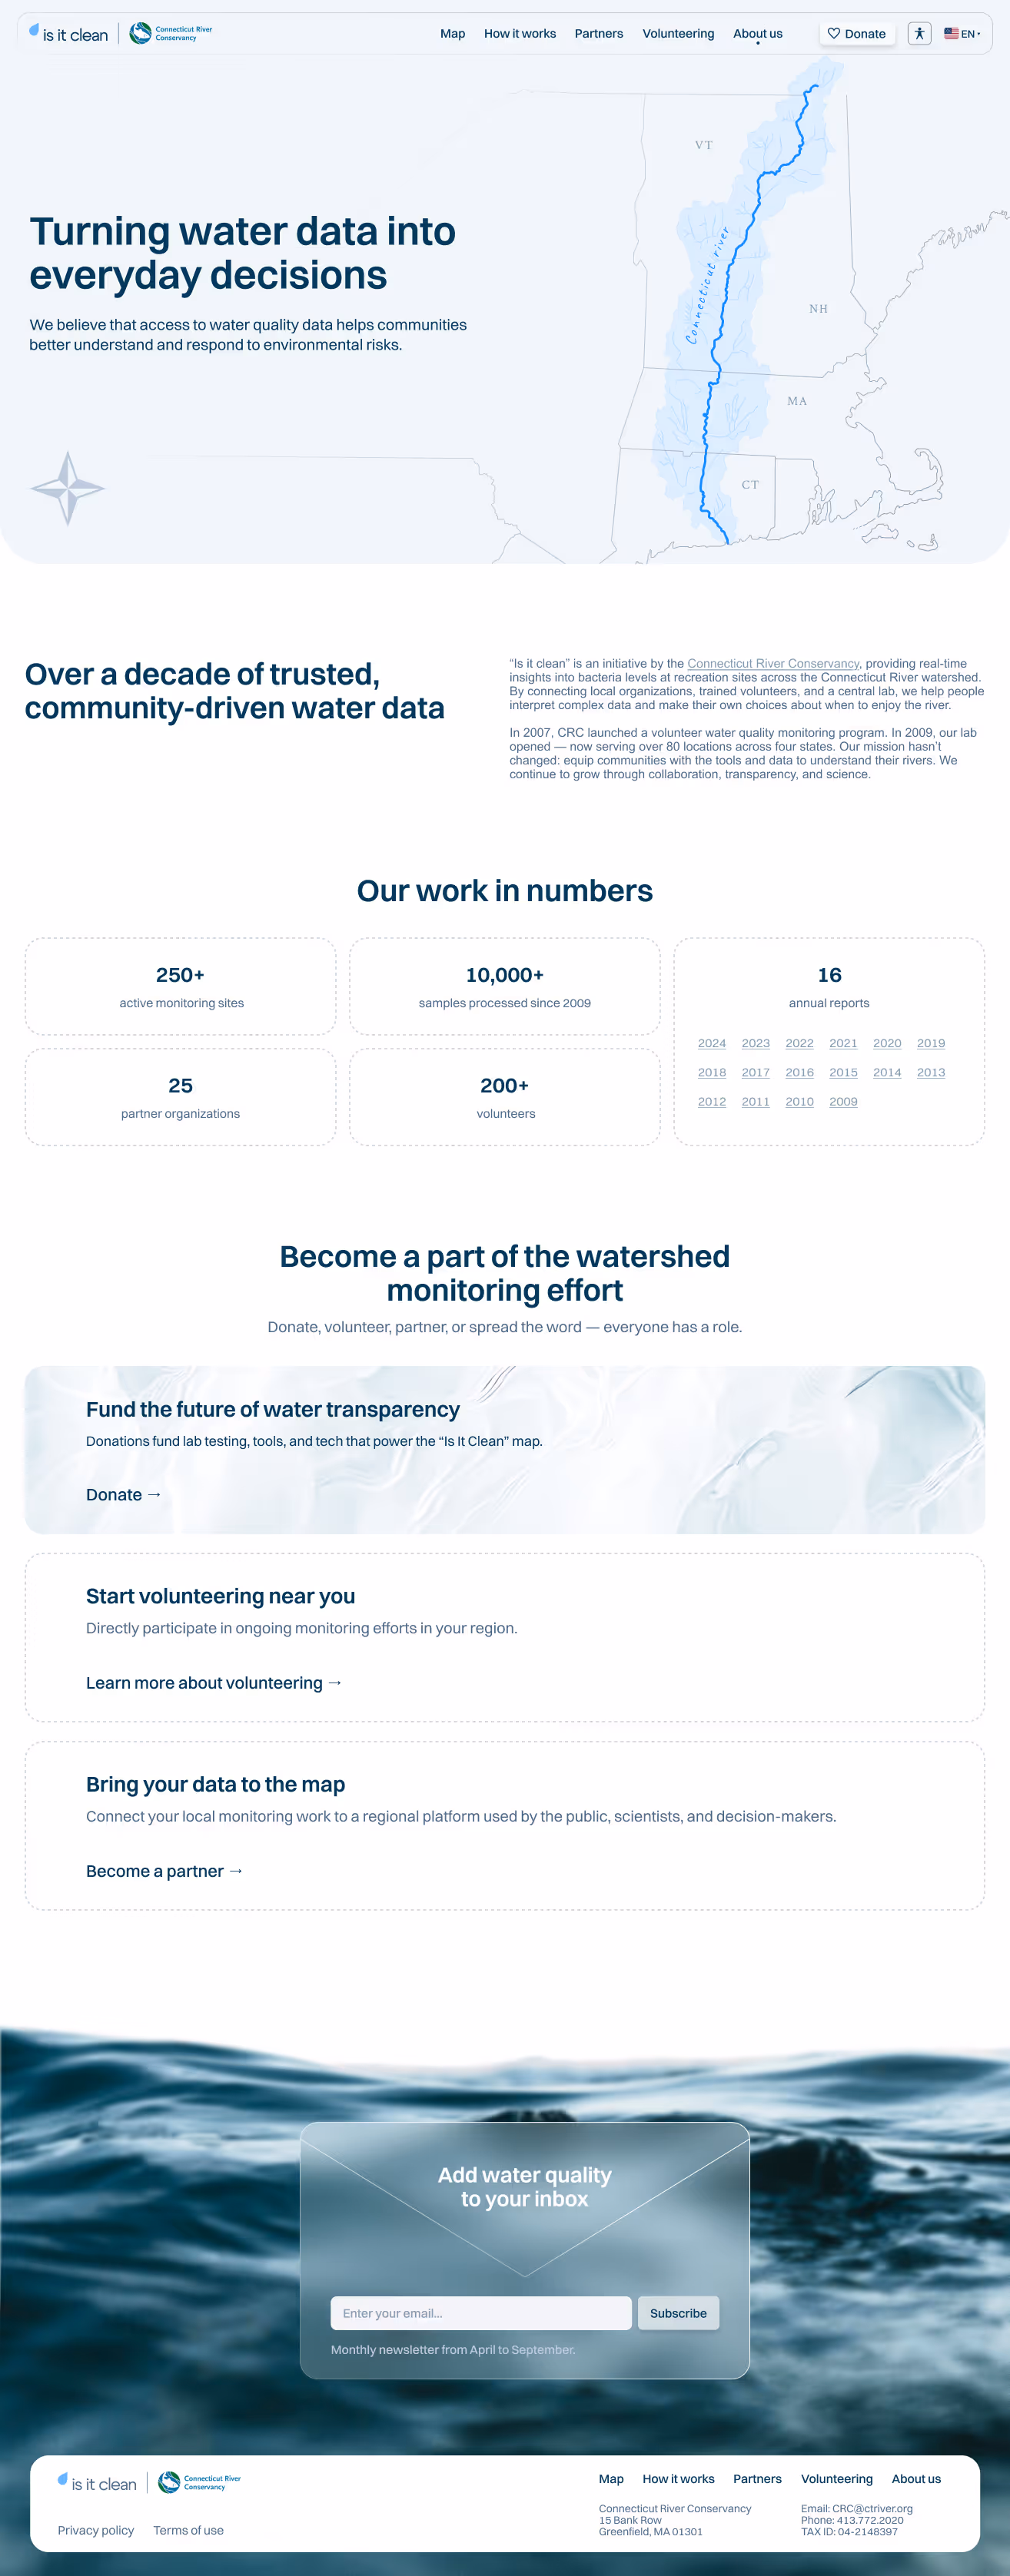
- Informational pages like “How it Works,” "About," “Volunteering,” and “Partners”.
- .
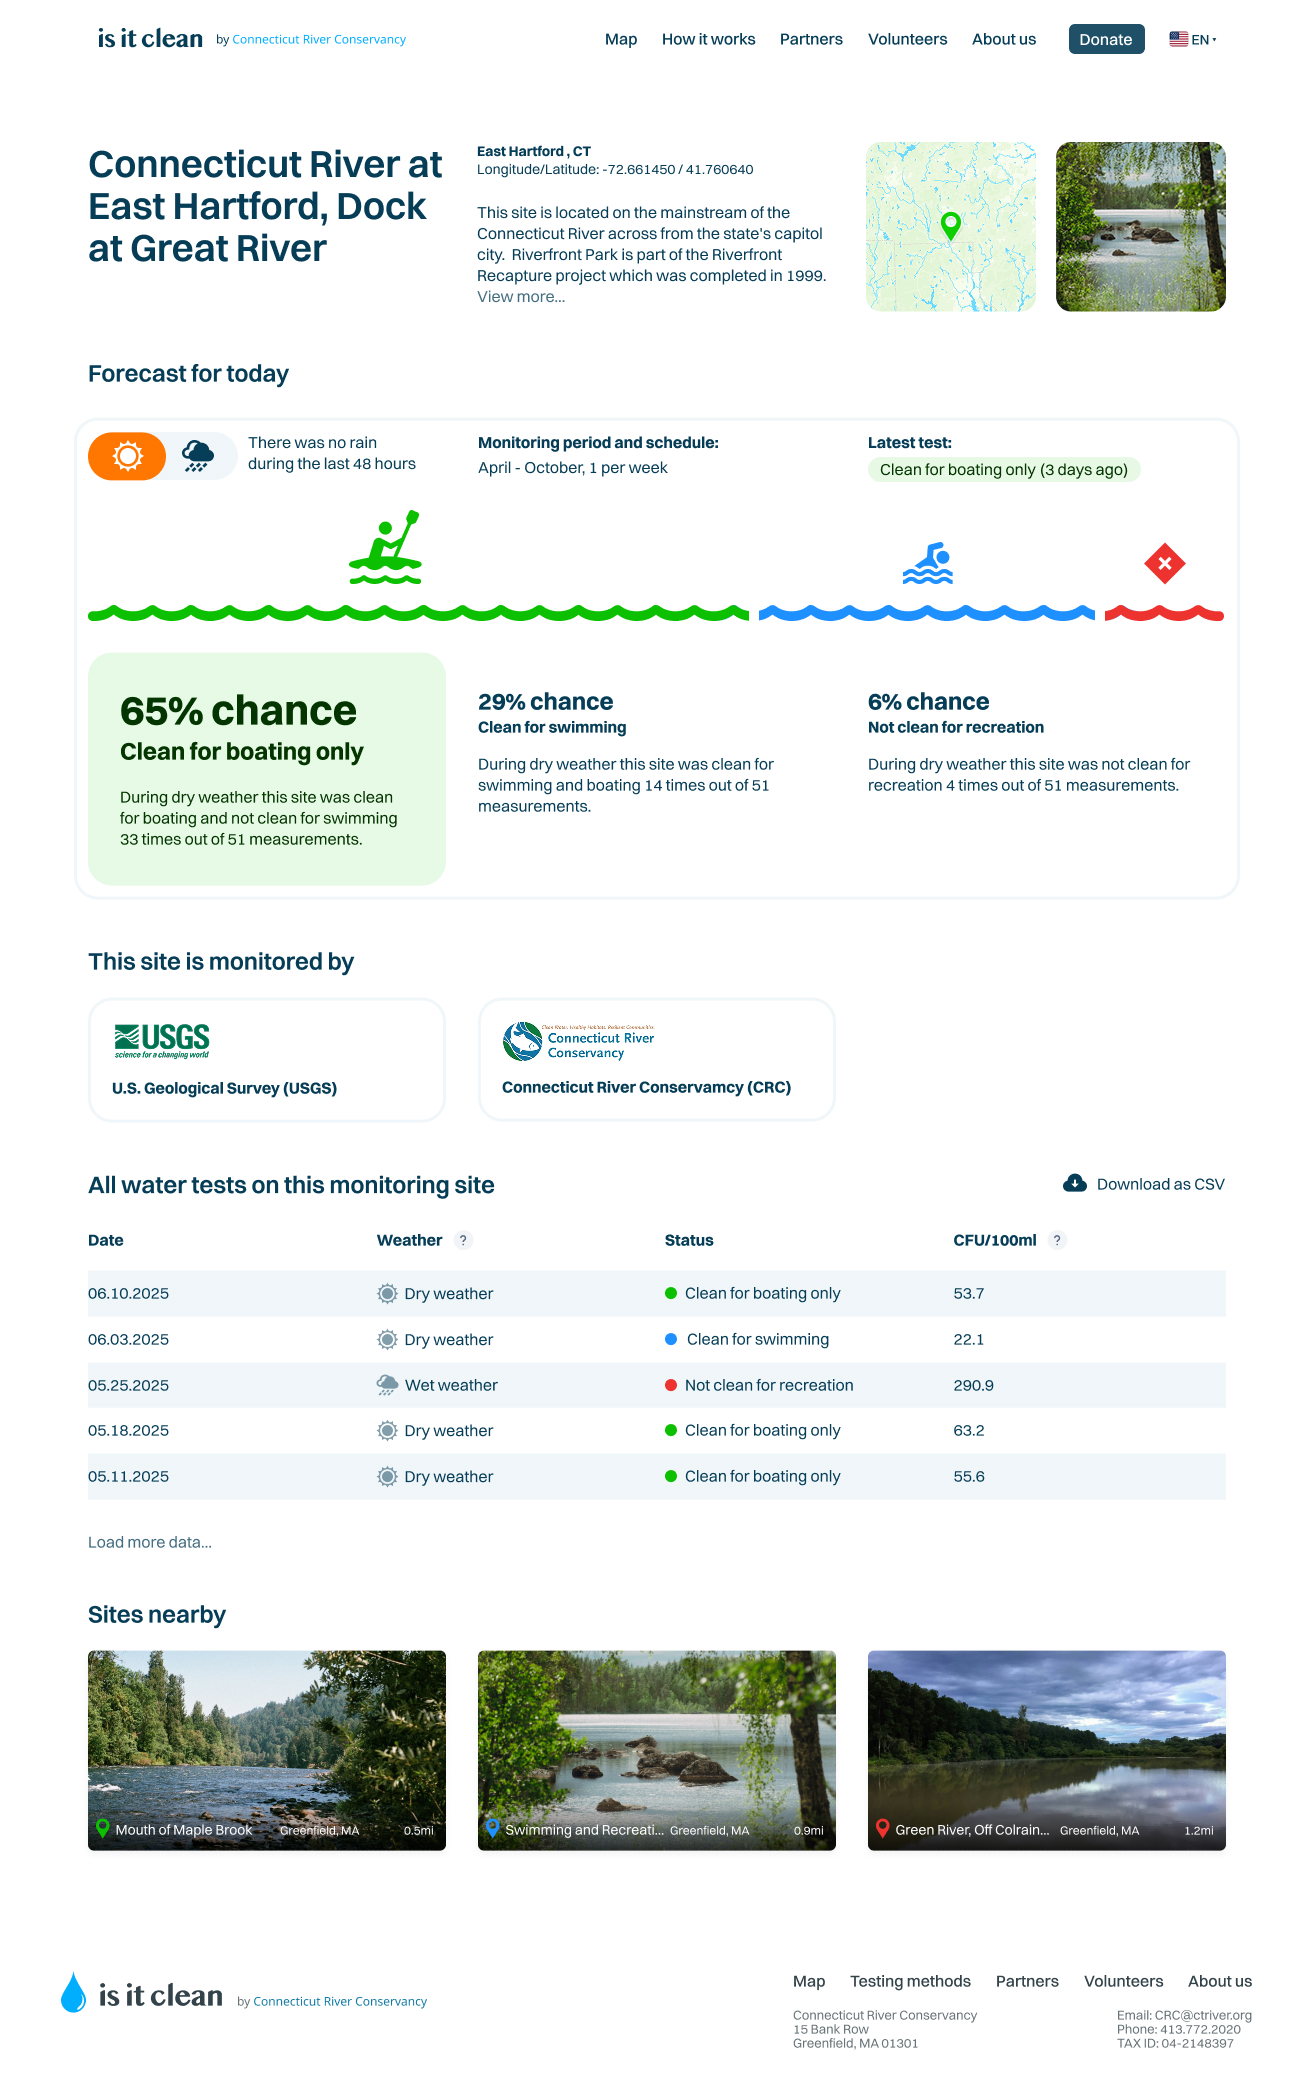
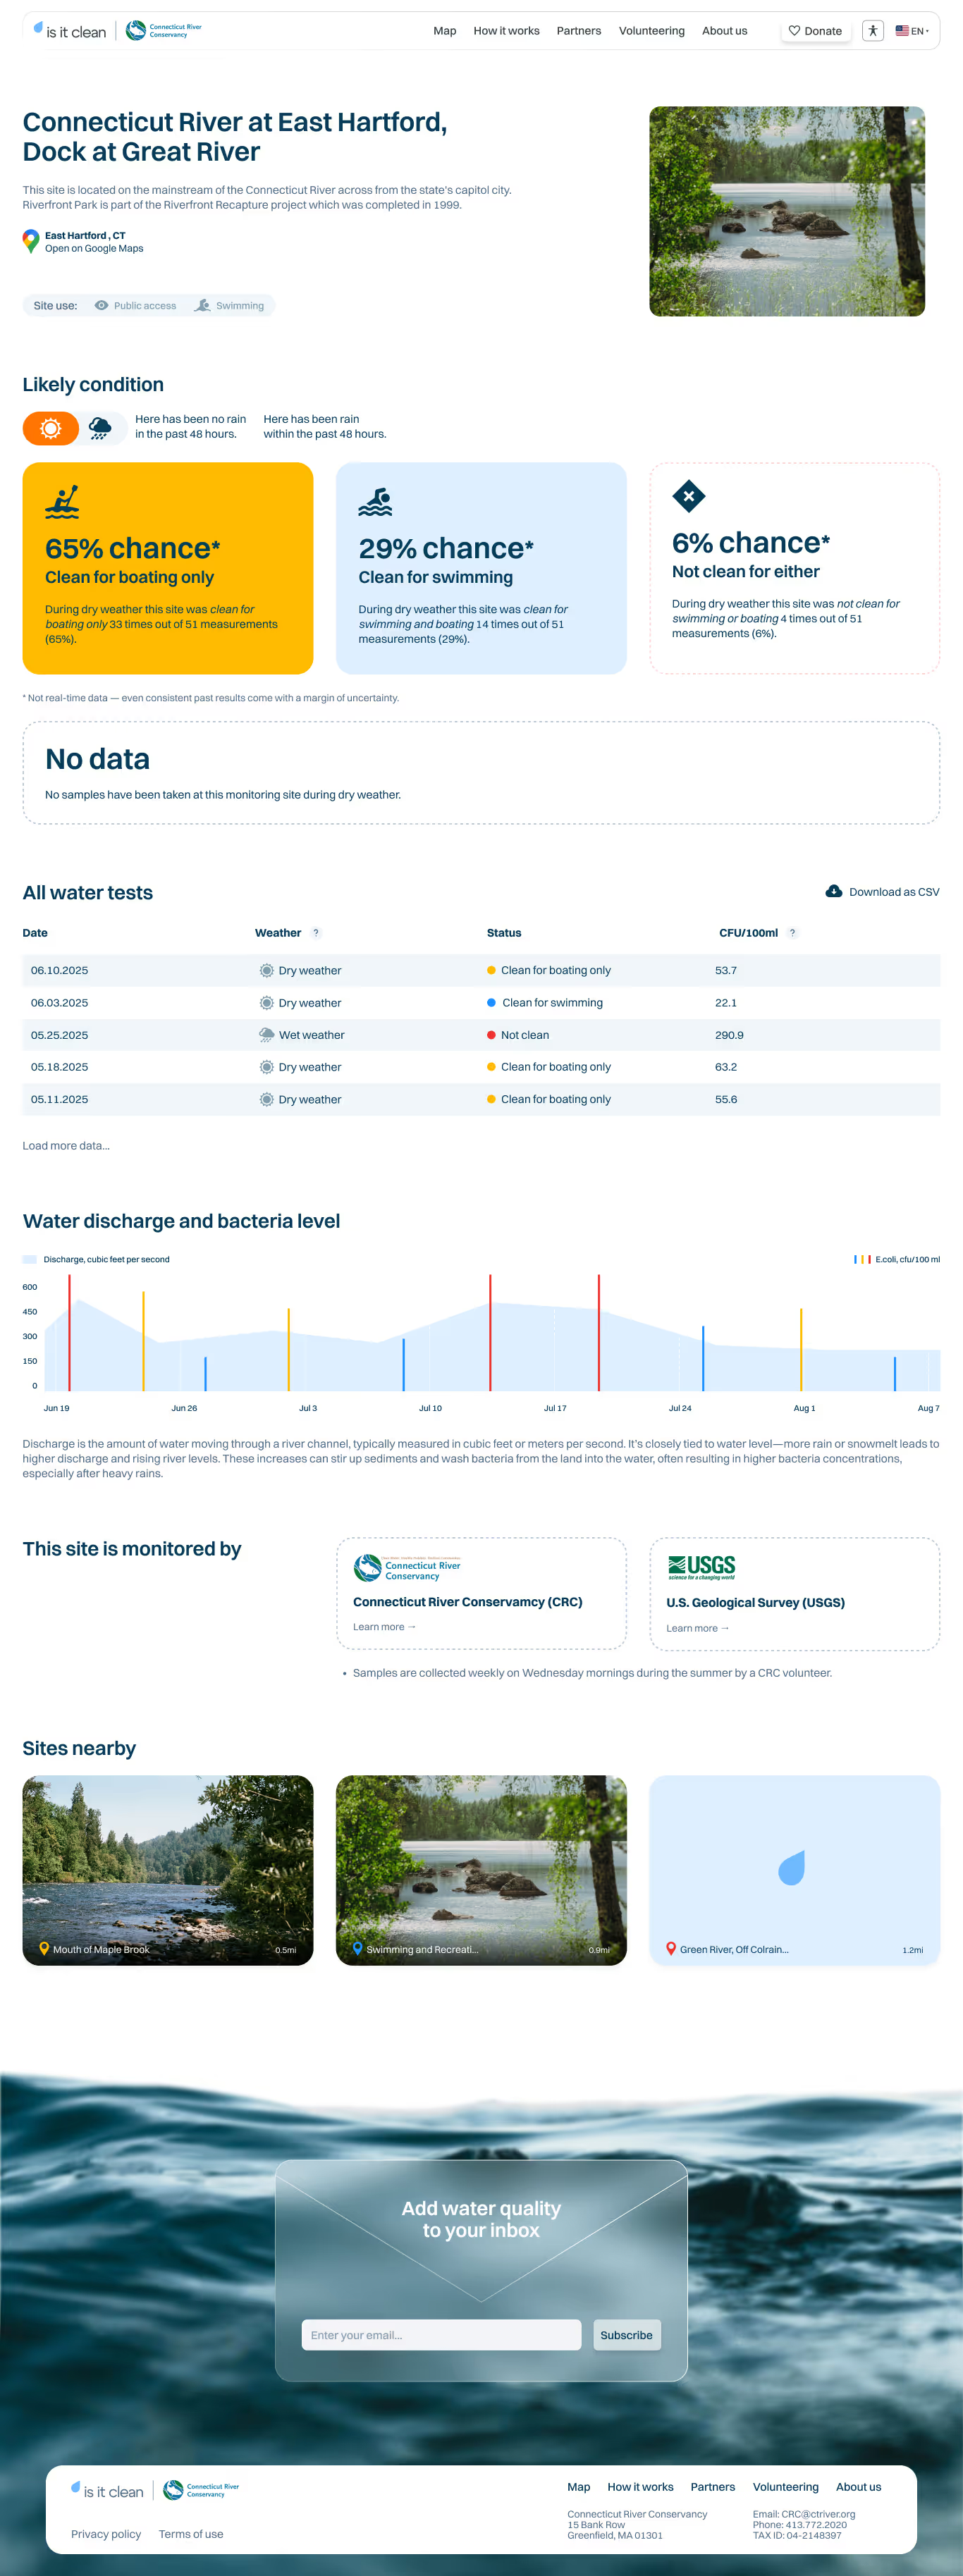
- Individual pages for each partner and monitoring site.
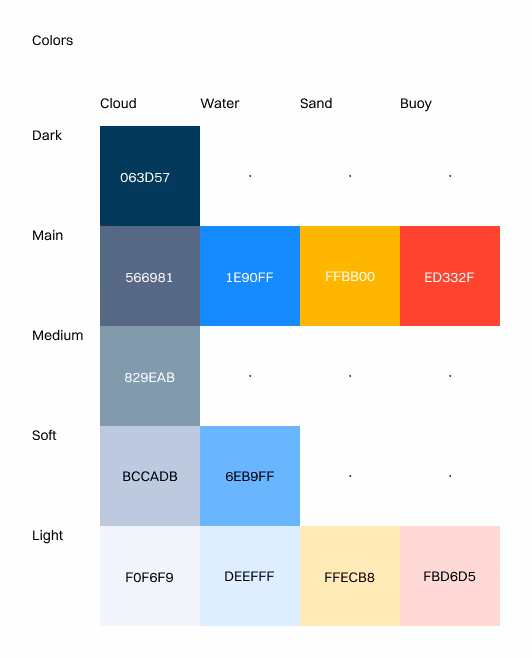
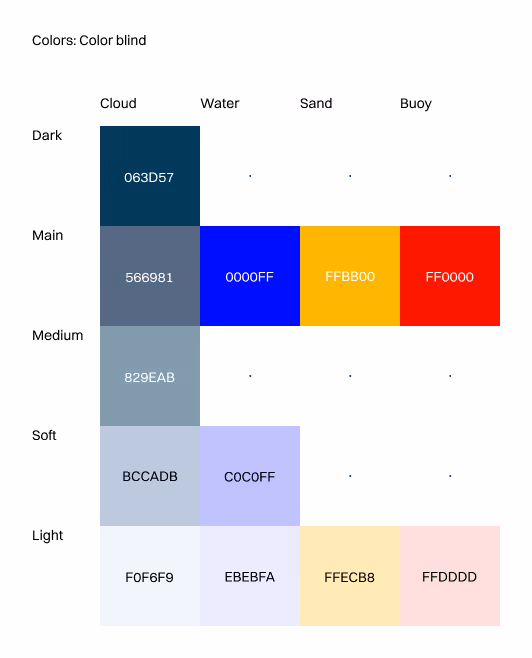
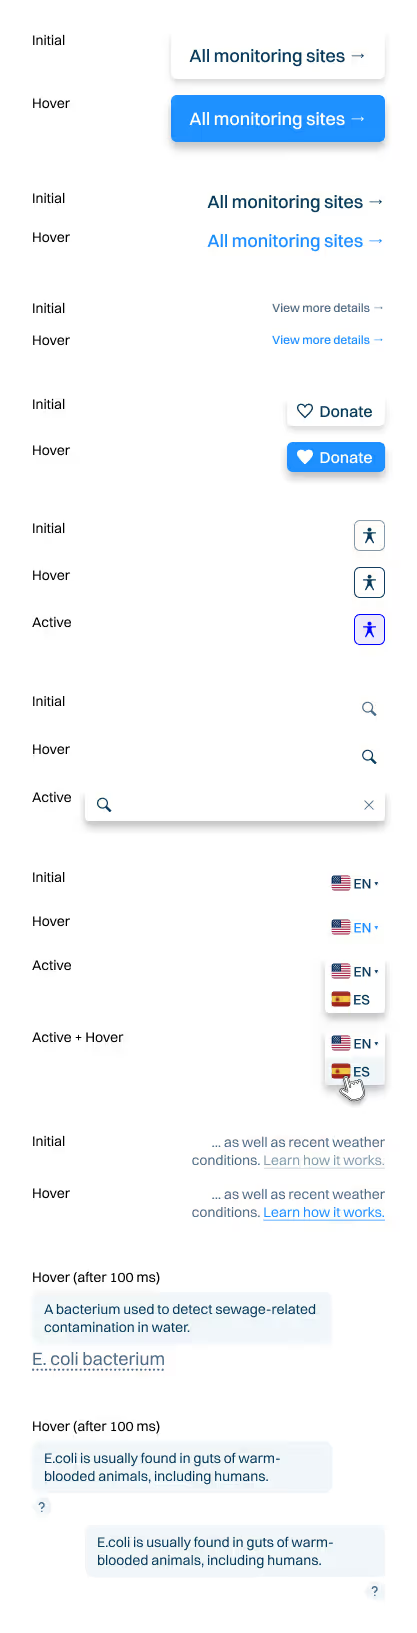
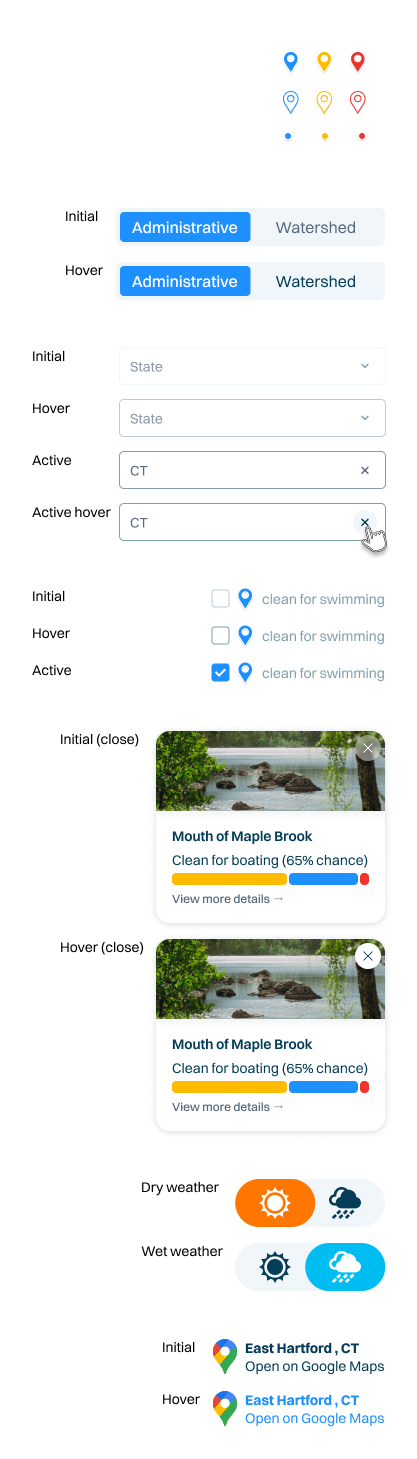
Designs
Design system
Development & Integration
- A Webflow front-end powered by Airtable and MongoDB.
- Custom backend syncing scripts that clean and process CRC's sampling data.
- Weather API integration for live rainfall status at each site.
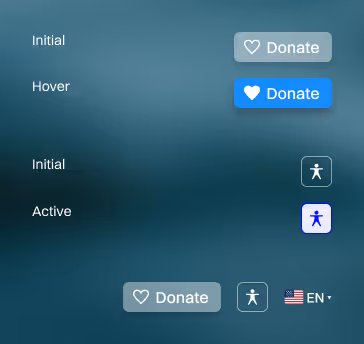
- Bilingual content via DeepL API + toggleable accessibility modes.
Documentation & Handoff
- Full developer and editor documentation in Notion (incl. CMS, filters, print templates, translation workflows).
- Design system spec sheets (tokens, logo uses, brand colors).
- Weekly recordings and annotated Figma boards.
- Integrated Notion AI and Fathom search to allow CRC staff to easily find past meeting moments or instructions.
Impact
The website is now the primary water quality resource for thousands of residents and visitors in the Northeast. It’s also a foundational platform CRC can build on for future programs.
- 250+ monitoring sites visualized with clean/unclean swimming/boating status.
- 20+ partner orgs integrated with auto-synced profiles.
- Full migration of historical data (10+ years).
- Real-time weather + E.coli fusion model displayed as clear forecasts.
Team & collaborators
This project was a collaboration between multiple organizations and individuals working across design, data, and development:
David Sundell — primary funder. President at DES Charitable Foundation.

Ryan O’Donnell — water quality data manager and project coordinator on CRC side.

John Dawes — coordination and technical leadership from Chesapeake The Commons.

Slava Fedosenko — project lead for design, UX, development, stakeholder coordination.

Kyrylo Bashkan — full-stack developer, responsible for the core functionality of the interactive map and sync with Airtable.
Tanya Matushenko — Webflow developer who implemented the front-end of the site.

Alyona Belyakova — design partner on visual explorations and conceptual framing.

Anastasiia Sedykh — assisted with the design of the project’s logo.